TherMOOstat: Crowdsourced Comfort
Too hot, too cold... ahh, just right!
Organization
UC Davis Energy Conservation Office
Contributions
UX Design, Usability Testing, Design Systems, Content Writing
Timeline
November 2024 - February 2025

Overview
The Impulse
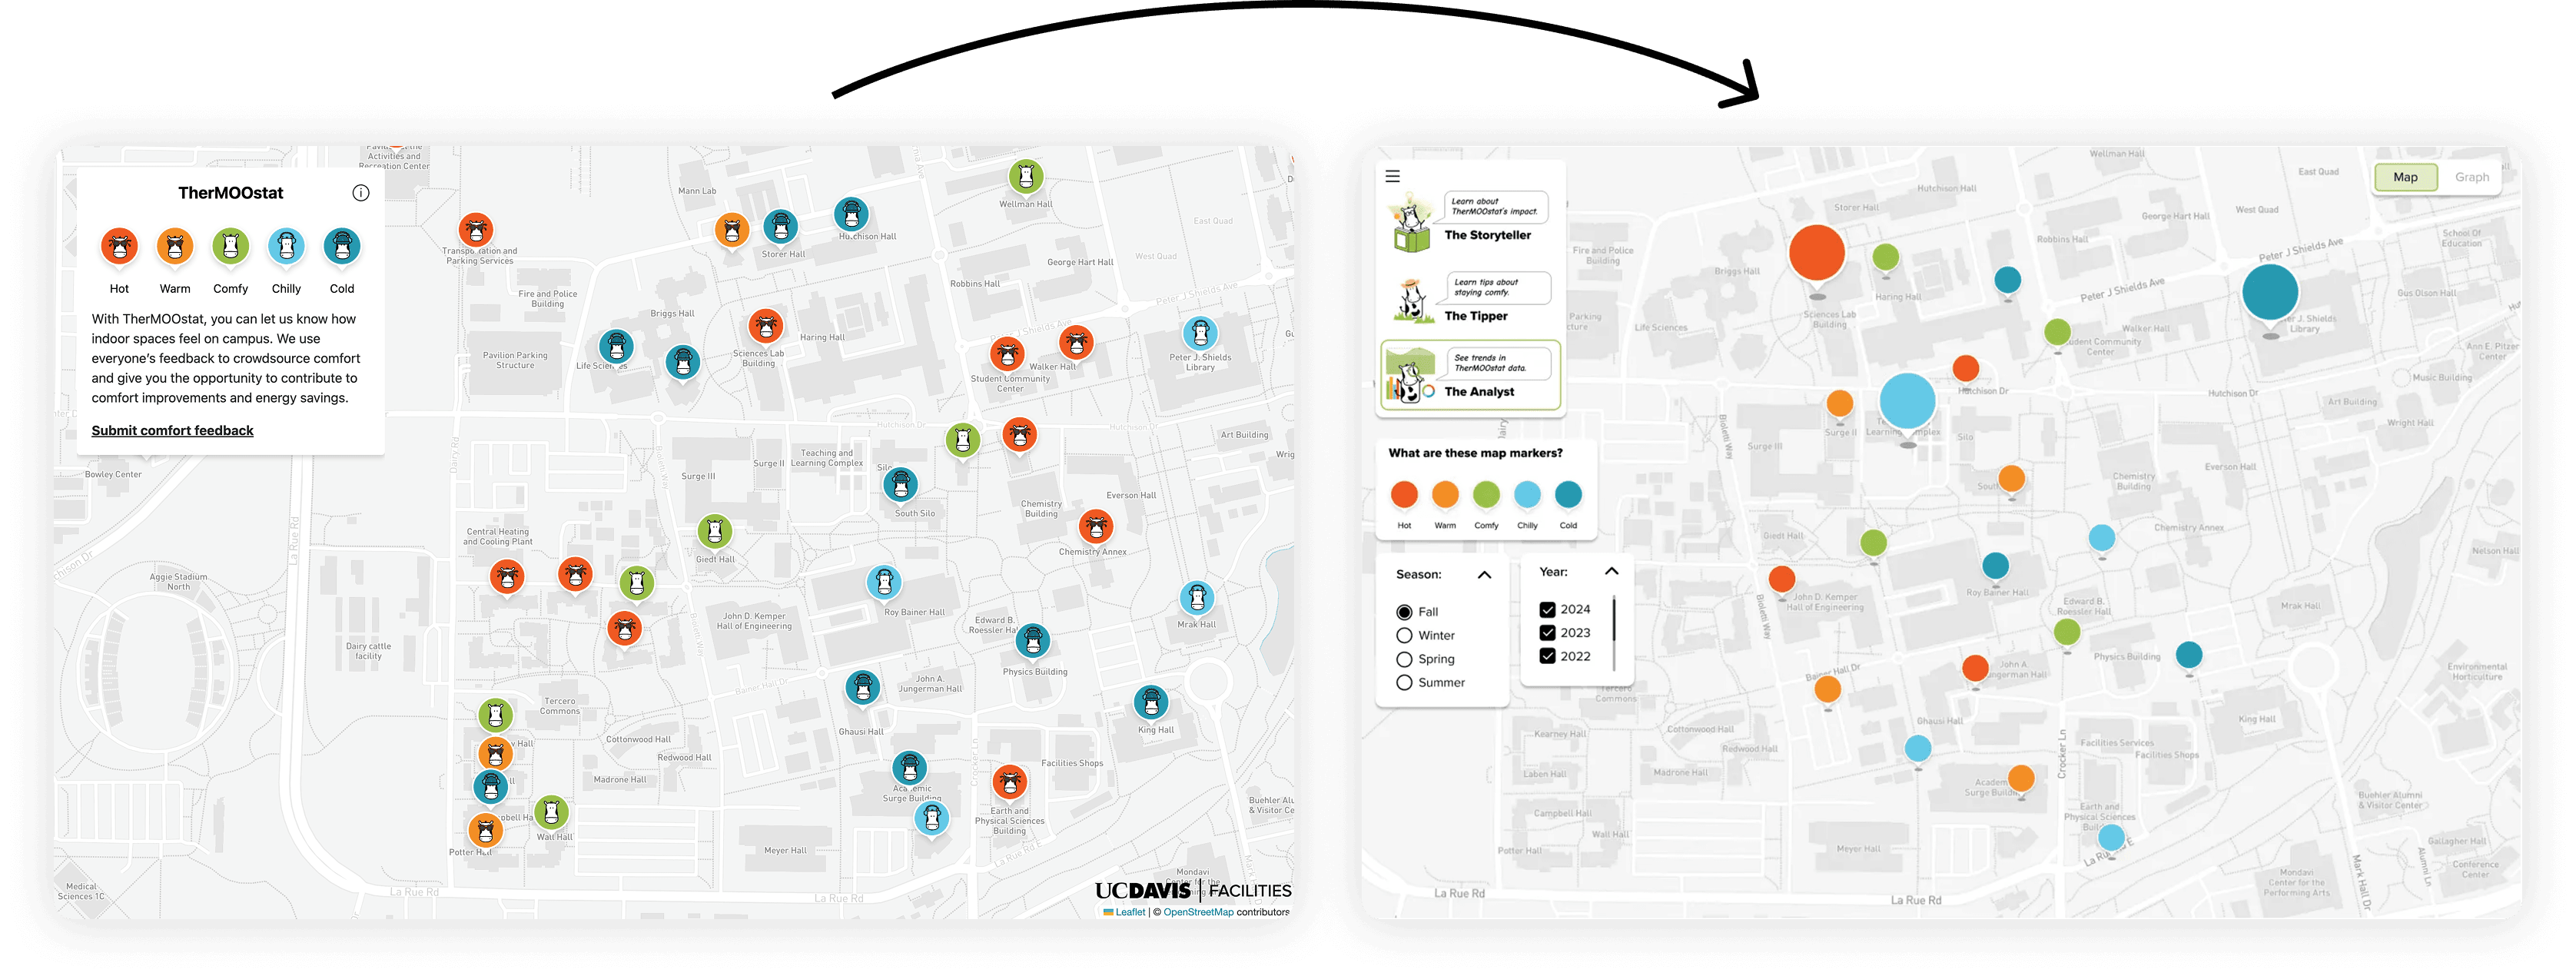
TherMOOstat is a campus tool that allows students to submit classroom comfort feedback to improve heating and cooling efficiency across UC Davis buildings. While the platform collected valuable data, students struggled to understand how their feedback translated into real impact on campus sustainability, limiting engagement and trust.
Our Solution
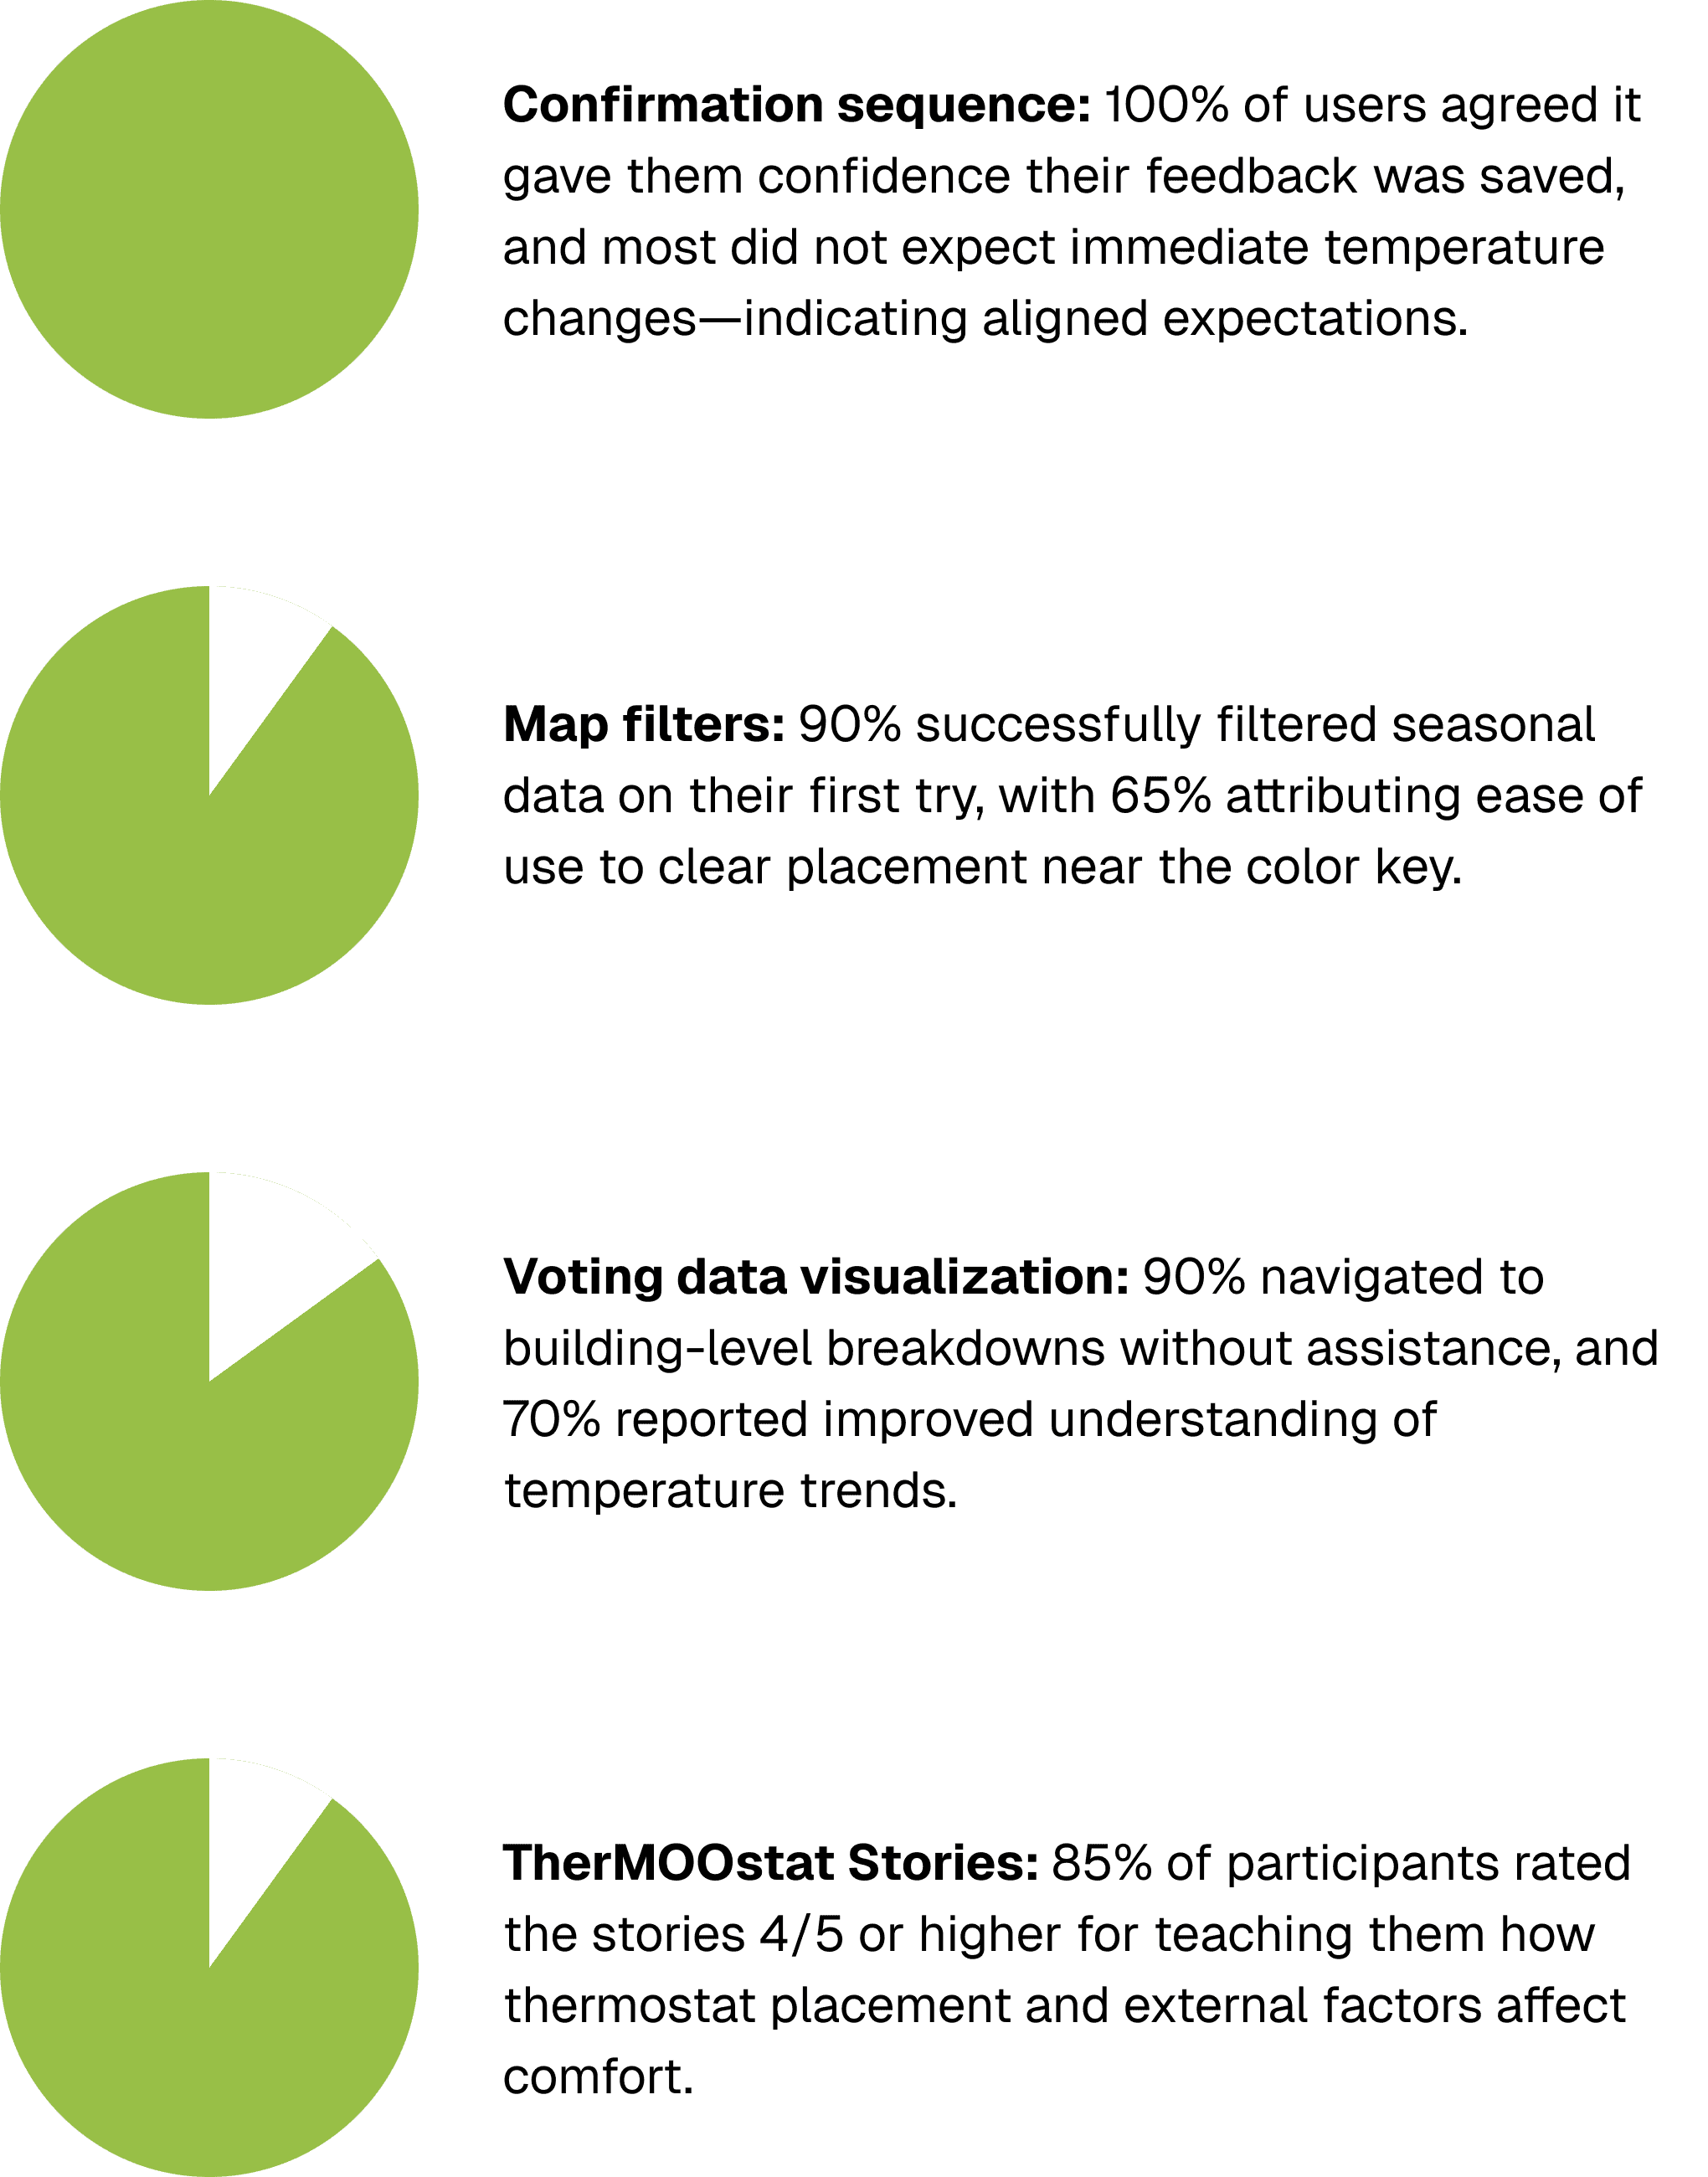
As part of my year-long internship with the UC Davis Energy Conservation Office, our team redesigned TherMOOstat to improve clarity, education, and usability. We simplified the map experience, restructured content to prioritize learning and impact, and validated our design through usability testing with 20 students. Post-testing, 85% of users successfully completed core tasks and reported increased understanding of energy systems and thermostat placement.
Research & Insights
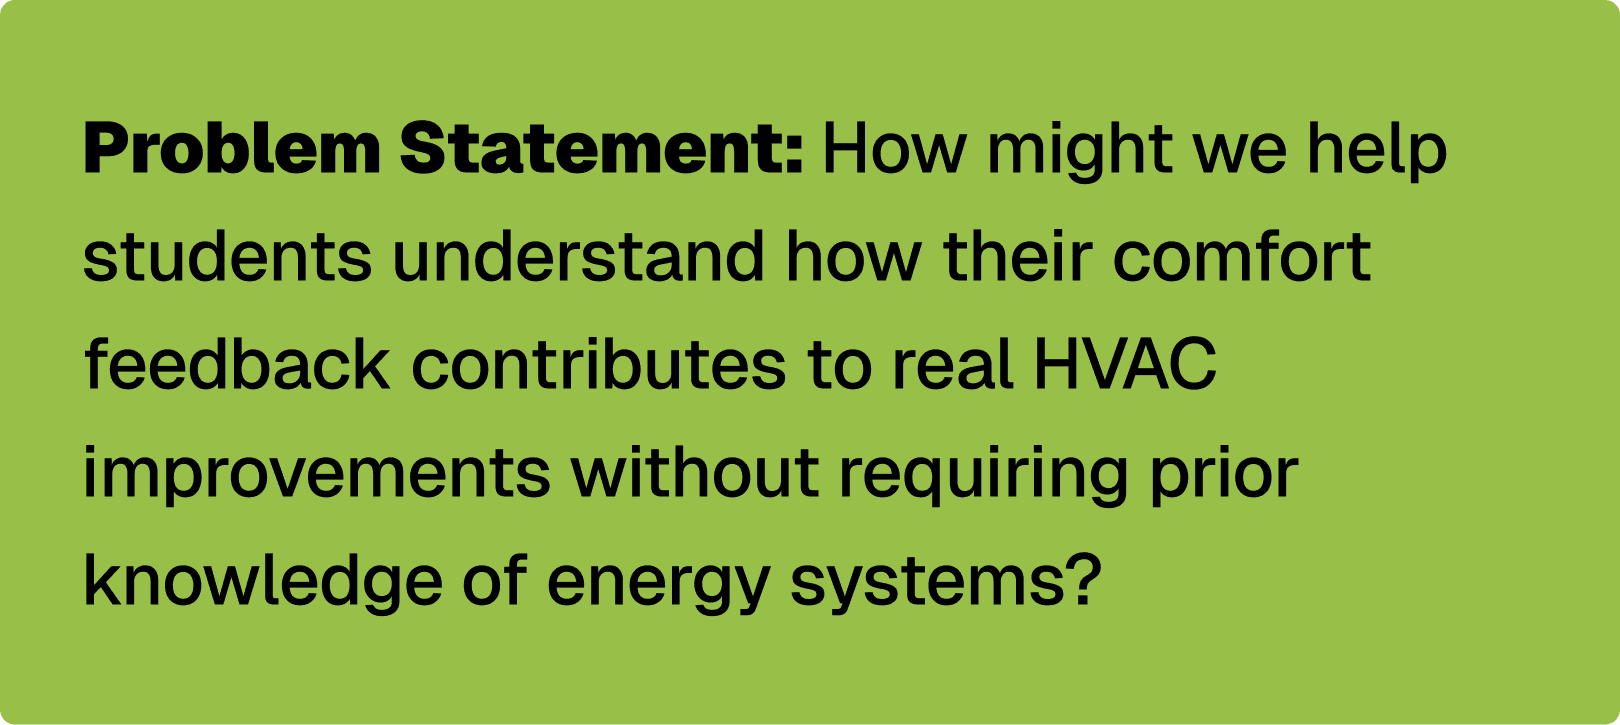
Understanding the Problem Space
TherMOOstat operates at the intersection of student satisfaction, behavioral change, and invisible infrastructure. Early exploration revealed a key tension: while students wanted comfortable classrooms, they lacked mental models for how HVAC systems worked or how individual feedback could lead to change.
Key Insights
From early observation sessions and later usability testing, we identified three core issues with an originally proposed redesign:
Conceptual confusion: Students did not understand why multiple map views or varying marker sizes existed.
Weak feedback-to-impact connection: Users struggled to see how submitting feedback resulted in real-world outcomes, reducing motivation to engage.
Overloaded interfaces reduce learning: Although visually engaging, dense UI elements prevented students fr
om discovering educational content organically.
These findings aligned with broader testing results showing that 50% of participants expressed confusion about map marker sizing, even after being prompted to hover for more information.
Early Direction
We translated our research into two guiding principles:
Familiarity first
Anchor the experience in recognizable patterns (e.g., Google Maps-style navigation) to reduce cognitive load.Education through interaction
Integrate learning directly into exploration, rather than separating it into documentation or help text.
This led us to redesign the experience around a single, structured map hub that layered education, data, and feedback outcomes together—rather than treating the map as a raw data dump.
Iterating…
What We Tested
We created high-fidelity prototypes and conducted 20 moderated usability tests (in person and on Zoom) over three weeks. Testing focused on:
Confirmation and loading sequences
Map exploration and hover interactions
Marker size and color comprehension
Filters (season, year)
Voting data breakdowns
Interactive TherMOOstat Stories
Key Findings
Final Solution
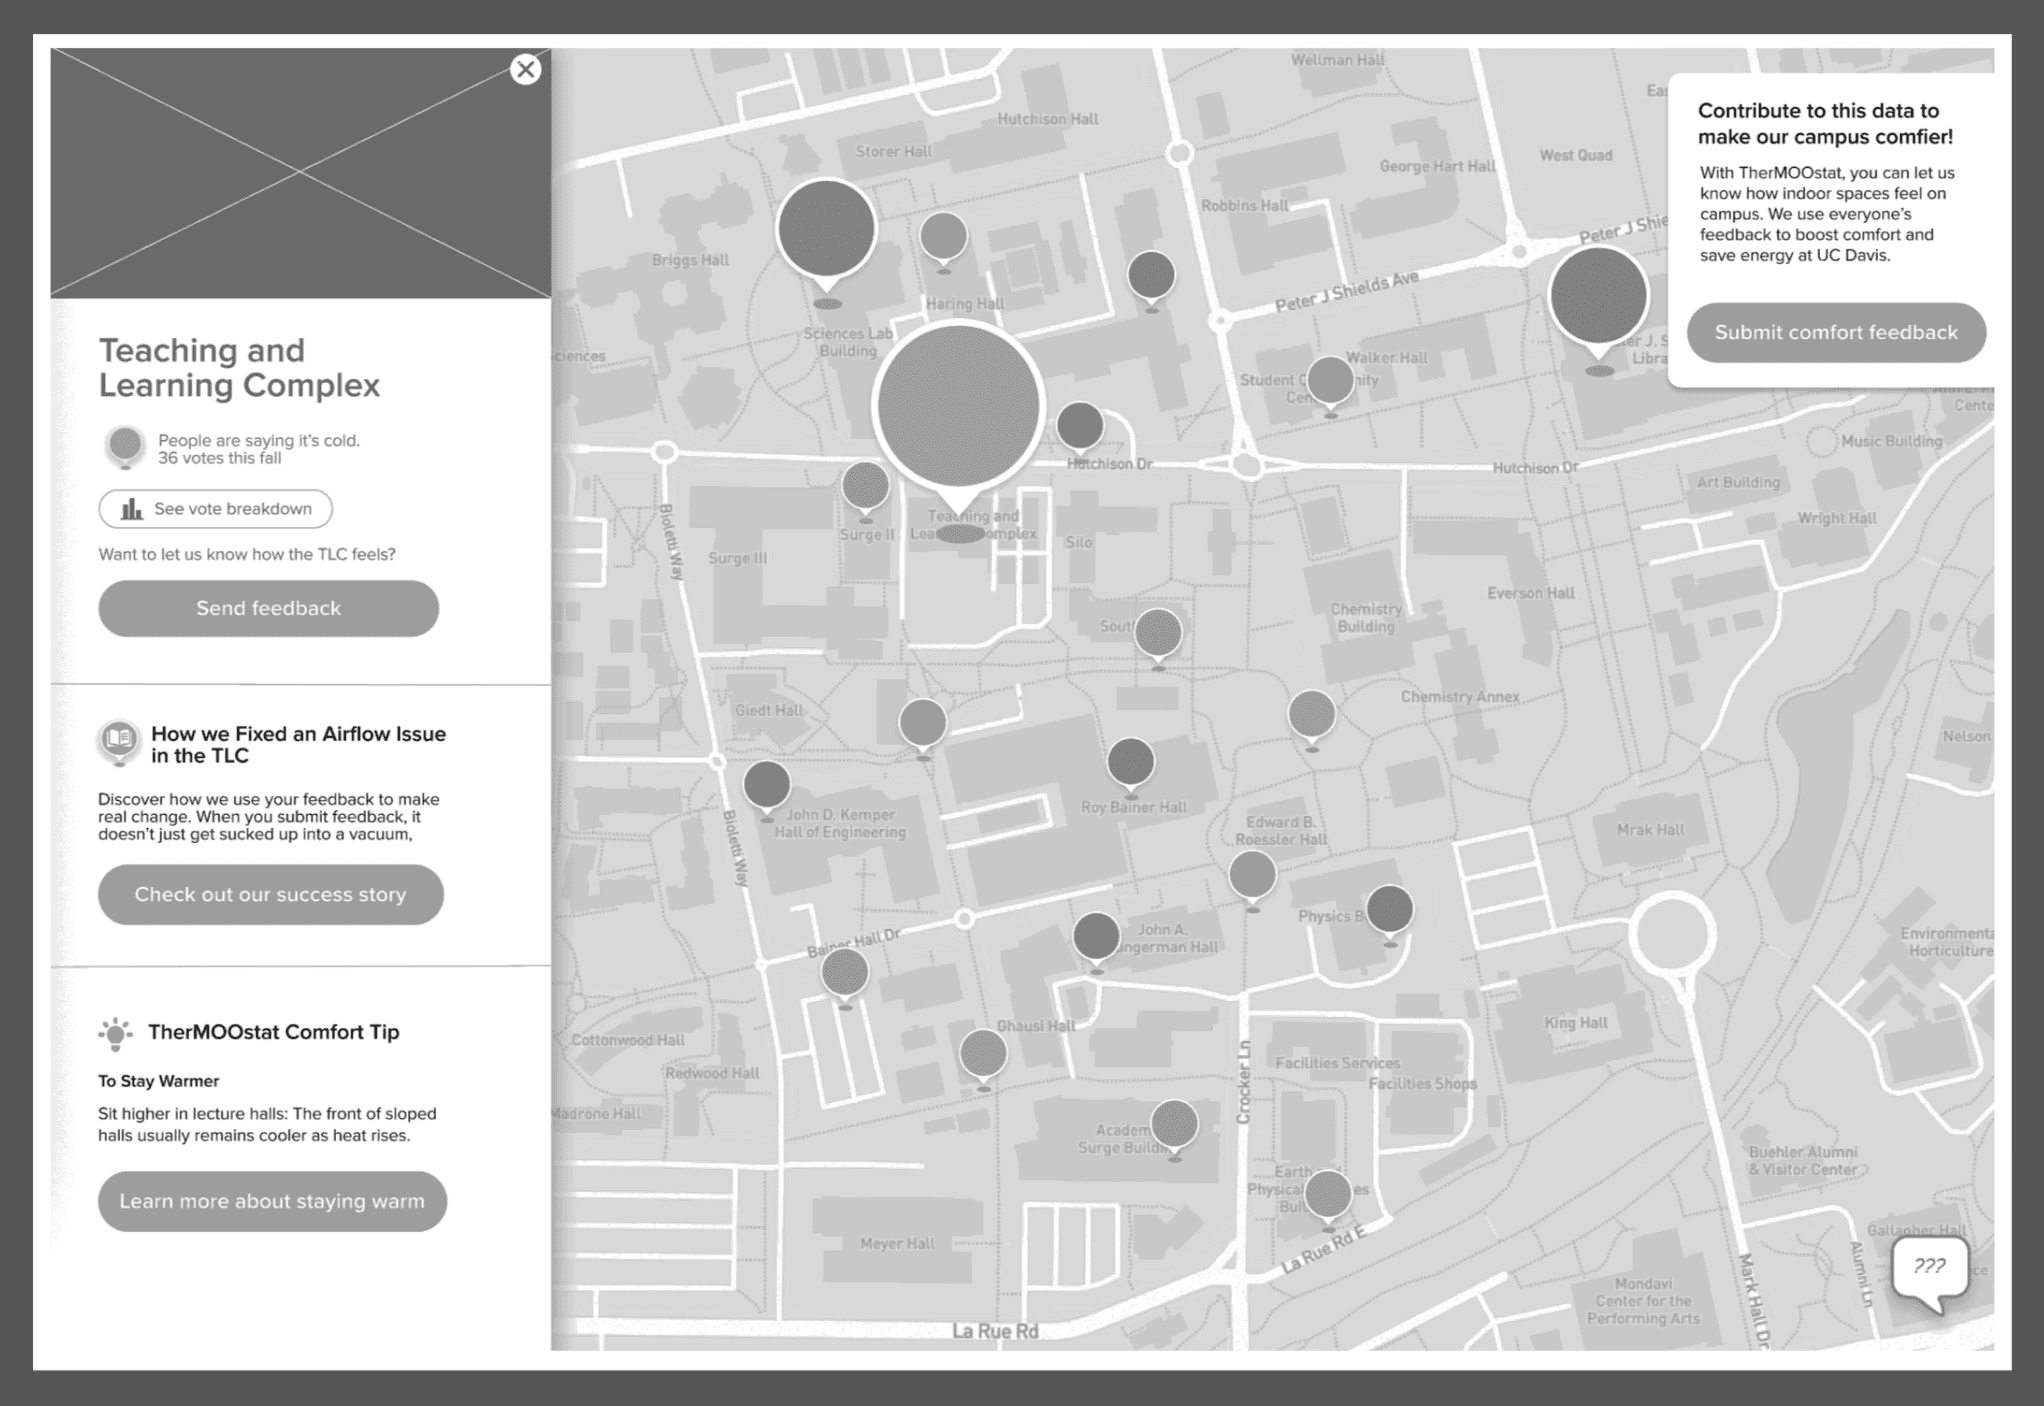
The final design centers on a single, cohesive map experience that balances data transparency with approachability:
Unified map hub with clear filters and color coding
Building sidebar displaying comfort data, voting trends, and context
Vote breakdown graphs to visualize consensus and prioritization
TherMOOstat Stories, short narrative cards explaining HVAC concepts and showcasing real improvements
Clear confirmation flows reinforcing trust and realistic expectations
Together, these changes improved usability, reduced cognitive overload, and helped students connect their feedback to tangible outcomes.
Reflections
Challenges
Translating invisible infrastructure into intuitive visual language
Avoiding over-education while still increasing understanding
Designing for both first-time users and those with industry familiarity (who paradoxically showed lower engagement)
Next Steps
Refine map marker sizing (test uniform sizing vs. explicit legends)
Expand TherMOOstat Stories with richer imagery and broader campus coverage
Further research how prior HVAC knowledge affects engagement and tailor experiences accordingly
Align confirmation and story-loading behavior with development constraints for production readiness
Thanks for visiting!
I'd love to chat about projects,
opportunities, and all things design.
Contact me :)